
Air pollution and land value
Wira Bandar PC is a fork of OpenTTD: OpenTTD's code with changes, free software under the GNU GPL v2. About and credits
Once a month the game measures how dirty the air is and what land is worth, all over the map. Congested roads, diesel and steam vehicles, aircraft and industry pollute; trees and parks clean the air, and electric transport makes no pollution at all. Dirty air makes towns unhappy, slows their growth and turns them against the companies whose diesel vehicles cause it, while dear land makes towns build taller.
See the air and the land
Section titled “See the air and the land”- On the main toolbar, click Towns (a house by a road; tooltip Open town directory or found town) and choose Air pollution map. The land in the main view is tinted by its air.
- For land value, choose Land value map in the same menu. The menu ticks the map that is showing; choose it again to hide the tint. Only one of these maps shows at a time.
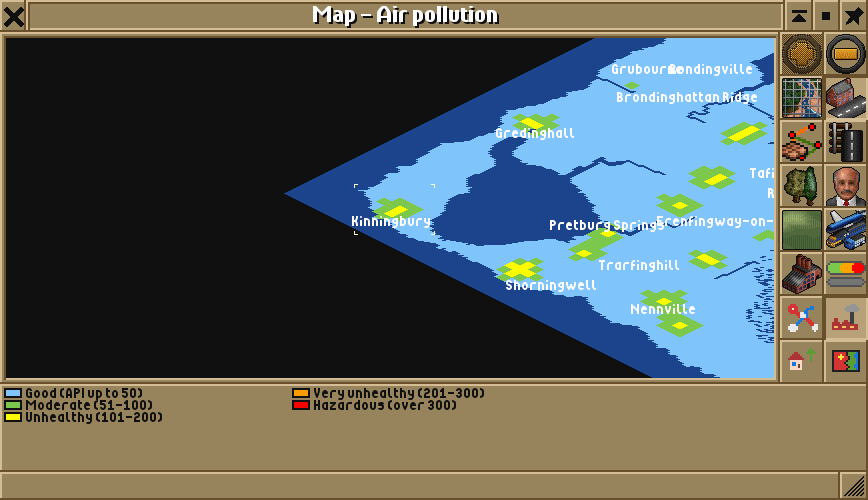
- For the whole map, click Map (the map icon; tooltip Open map, extra viewport, cargo flow or list of signs), choose Map of world (or press F4), then the air pollution button (a factory under smoke) or the land value button (a house with an arrow up).
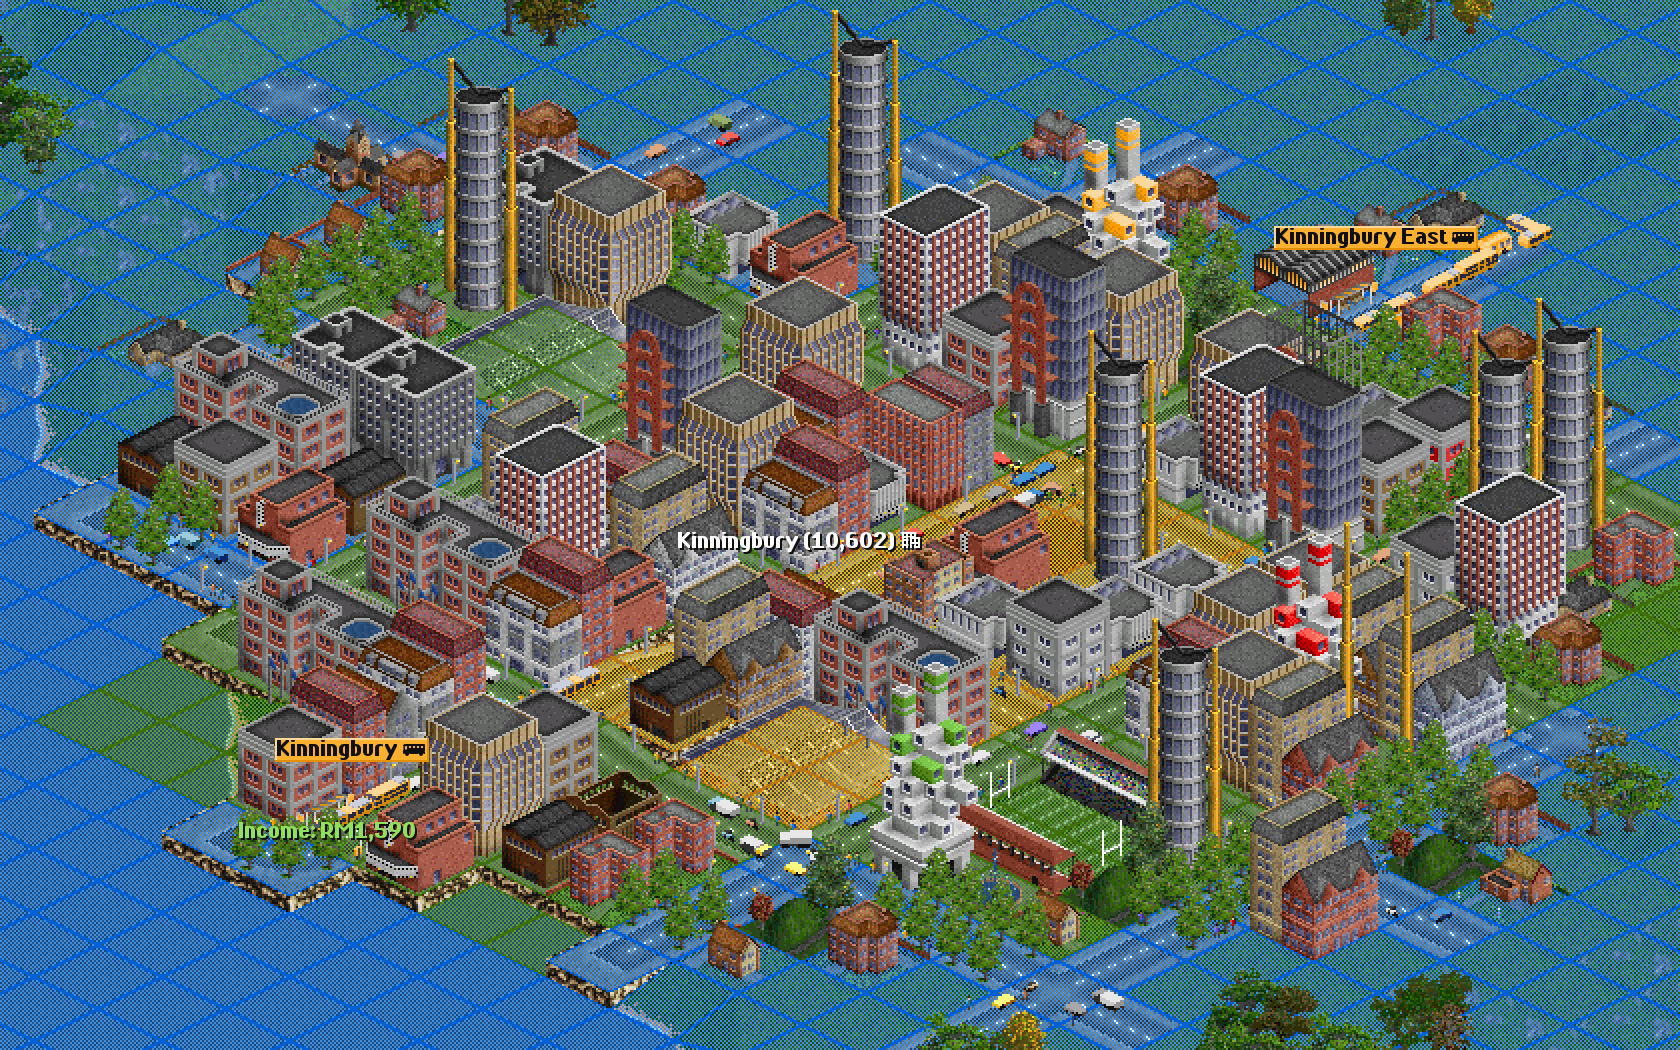
Air pollution map and Land value map are only in the Towns menu while the setting below is on. Two more places give the numbers:
- The town window has a line like Air: API 70 (moderate); land value 50 (medium): the averages over the town’s houses, weighted by the people who live in them. The air is in red when it is unhealthy. Until the first survey, it says Air and land value: measured at the end of the month.
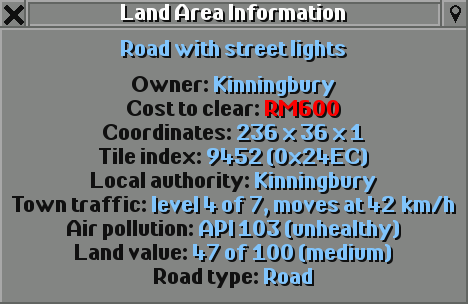
- Land Area Information gives Air pollution and Land value for any tile: on the main toolbar, click Help (the question mark; tooltip Open land information, screenshot menu, credits, or developer tools), choose Land area information and click the tile. Both are worked out in cells of 4 by 4 tiles, so the tiles of a cell share them.
Air pollution
Section titled “Air pollution”The air is measured on Malaysia’s and Singapore’s air pollutant index (the API in Malaysia, the PSI in Singapore):
| Air | Index | On the Map | In the main view |
|---|---|---|---|
| good | up to 50 | light blue | blue |
| moderate | 51 to 100 | green | green |
| unhealthy | 101 to 200 | yellow | yellow |
| very unhealthy | 201 to 300 | orange | orange |
| hazardous | over 300 | red | red |
What pollutes and what cleans
Section titled “What pollutes and what cleans”| Source | Pollution a month |
|---|---|
| A road tile with town traffic | 3 times its traffic level squared: 12 at level 2, 48 at level 4, 147 at level 7 |
| A diesel bus | 80 |
| A lorry | 120 |
| A diesel train | 120 |
| A steam train | 200 |
| A ship | 60 |
| An aircraft at or over an airport | 150 |
| A tile of a factory, refinery, steel mill, sawmill or other processing industry, or of a power station | 150 at normal production, more or less with it |
| A tile of a mine or oil well | 60 |
| Farms, forests and plantations; banks, water towers and other town industries | nothing |
| Electric buses, trams, trolleybuses under wires, electric trains | nothing |
| A tree | takes up 3 |
| A park reaching the cell | takes up 40 |
- Vehicles count where they are when the month ends; vehicles in a depot or stopped don’t count.
- The wind spreads pollution over about two cells around where it comes from, so a busy cell also dirties its neighbours.
- The index is a little under half of what is left once trees and parks have taken their share, and it moves a quarter of the way to the new value each month: the air follows its sources over a few months.
- Light pollution makes every source 60% as strong, Heavy pollution 150%. Trees and parks clean as much either way.
With Normal pollution, most of the map has good air and only the busiest town centres and the land next to heavy industry get moderate or worse.
Land value
Section titled “Land value”Each cell is worth 0 to 100:
| Part | Land value |
|---|---|
| Where it is in a town | centre 56, inner suburb 48, outer suburb 40, outskirts 34, edge 30; countryside 10 |
| The town’s size | 3 more for each doubling of the population above 1,000, at most 15 |
| Police, fire, health (a clinic or hospital) and education (a school or university) reaching it | 4 more each |
| A university reaching it | another 4 |
| A hawker centre reaching it | 2 more |
| A park reaching it | 8 more |
| A good passenger station covering it | up to 12 more for a railway station, up to 5 for a bus or tram stop, by its passenger rating; 4 more at a transport hub or BRT station |
| Water in the cell | 5 more |
| Industry in the cell | 5 less |
| Air pollution | a fifth of the index less, at most 50 less |
Town policies add their part: the Car-free centre ordinance makes the centre worth 5 more, and Transit-oriented development 10 more around railway stations (see budgets and ordinances). A council that renewed its estates in the last ten years adds 5 as far as the outer suburbs, and run-down estates take 5 off (see town councils). Like the air, land value moves a quarter of the way to its new value each month.
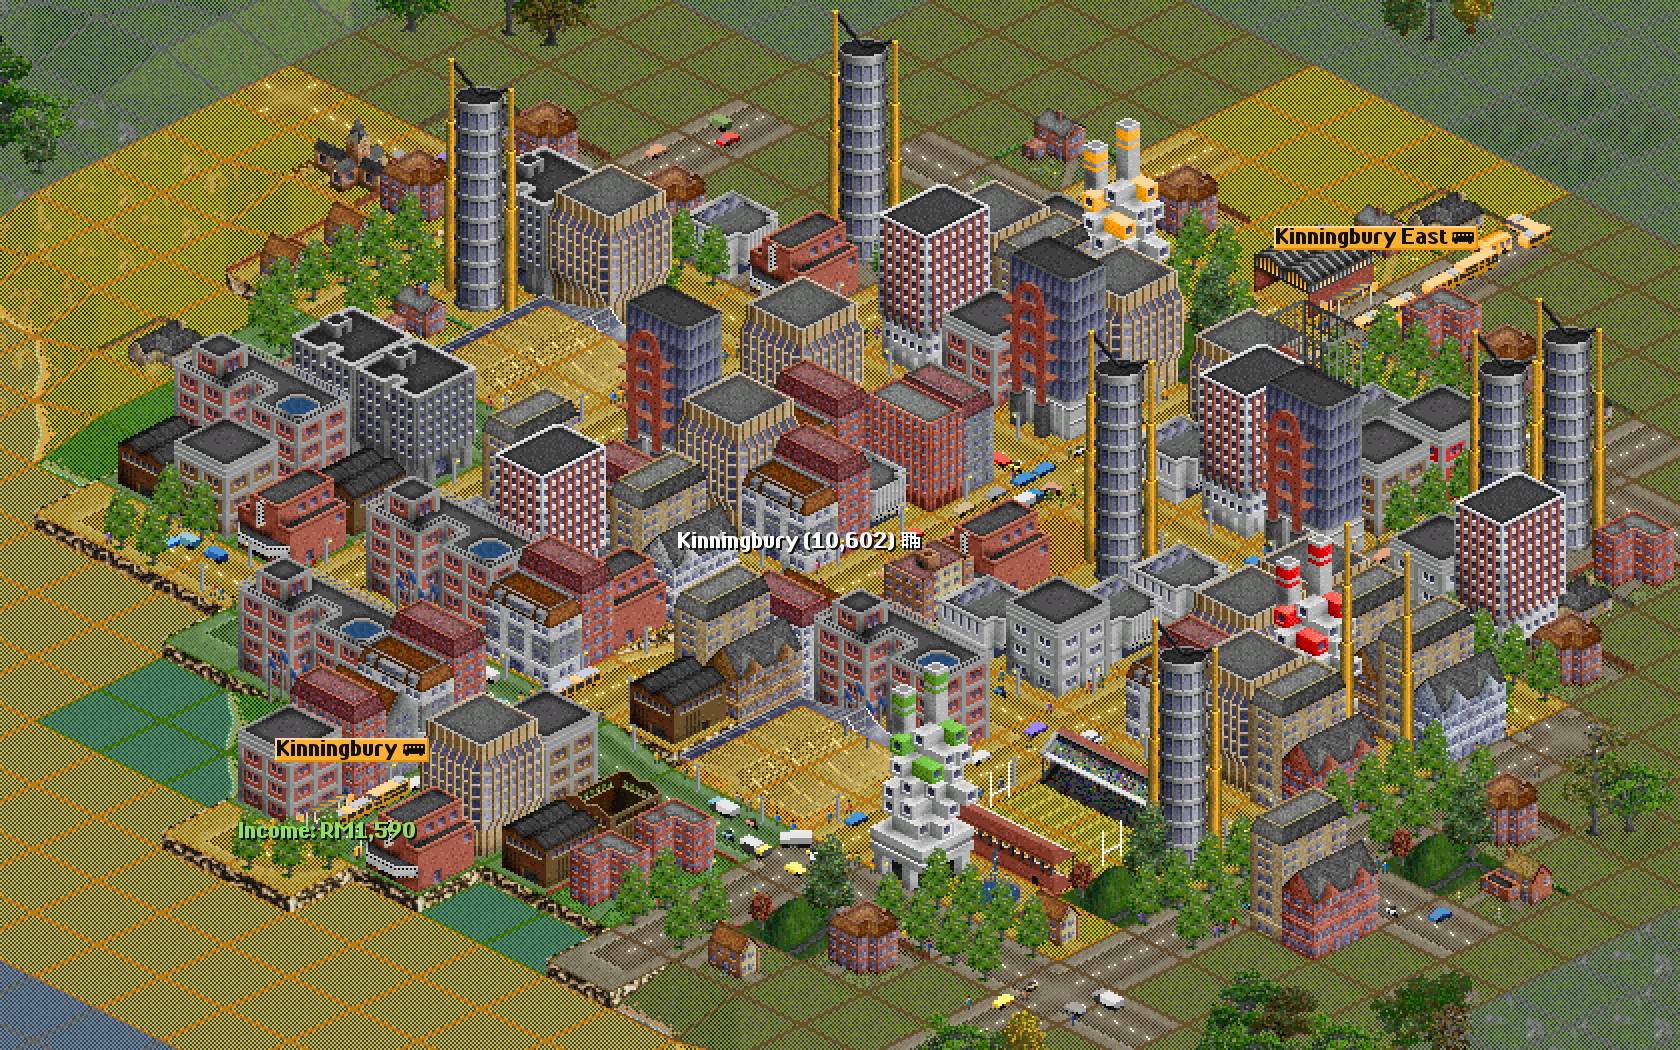
The words: very low under 20, low 20 to 39, medium 40 to 59, high 60 to 79, very high 80 and more. The Map shows them in dark grey, field brown, yellow, green and white; the main view tints them grey, brown, yellow, green and white.
What it does to towns
Section titled “What it does to towns”- Happiness: a town loses a point of happiness for every 10 of its index above 50, at most 15 points.
- Growth: a polluted town takes longer between new houses: a percent for every 6 above 50, at most 25%.
- What towns build: on land worth 30 to 59, most of an ordinary town, towns build as in OpenTTD. Dearer land makes blocks of flats and offices with many people a tile likelier, up to 3.5 times; land worth less than 30 (dirty air, industry, far out) does the same for small houses. That goes for new houses and for the ones towns rebuild; public buildings are left alone.
- What towns think of you: each month, a town whose air is moderate or worse thinks less of each company whose diesel road vehicles and trains are in or near it: about 2 rating points for each diesel bus (with Normal pollution), at most 30 a month, and never below Poor. A company that runs only clean vehicles there, at least three, gains 10 a month, up to Good.
- News: when the air where a town’s people live turns unhealthy, the news says Haze over Kinningbury! The next warning for that town comes only after its air has cleared below 90.
- Money: with town budgets, a town’s taxes follow its land value: 30% more on land worth 80, 30% less on land worth 20. With states, the premium your company pays for land is higher where land is dear.
- Run electric buses, trams and electric trains through polluted towns: they make no pollution and win the town over.
- Parks clean the air and raise land value at the same time; trees help too.
- Keep heavy industry and power stations away from town centres: the wind carries their pollution about two cells.
- Busy roads are a town’s own polluters. Carrying more of its passengers takes cars off the road, and the Low-emission zone and Tree planting ordinances help too (see budgets and ordinances).
- Good railway stations and city services make land dear, and towns build taller around them.
Switching it off
Section titled “Switching it off”SettingAir pollution and land value
Main toolbar: Options and settings (the gear) → Game options → Advanced tab → Environment → Towns. Or type its name in the Filter box.
Choices: Off, Light pollution, Normal pollution, Heavy pollution. Default: Normal pollution. Choose Off for the game as in OpenTTD.
With Off, there is no pollution and no land value, as in OpenTTD: the Towns menu items go, the town window and land information drop their lines, the Map views show plain land, and towns build as in OpenTTD. In a new game or an older save, the first figures come at the end of the first month.
See also
Section titled “See also”- Town traffic and street life: the congestion that pollutes
- Buses: diesel and electric buses
- City services: parks, police, fire, health and education
- Buildings: what towns build
- Budgets and ordinances: low-emission zones, tree planting and more
Wira Bandar PC is a fork of OpenTTD. It is OpenTTD's code with changes, not a game made from scratch. OpenTTD is made by the OpenTTD team and contributors and is free software under theGNU General Public License version 2; Wira Bandar PC keeps that licence, OpenTTD's credits and copyright notices.Source code ·OpenTTD ·About and credits
Wira Bandar PC is not made or supported by the OpenTTD team, so please don't report its bugs to OpenTTD (see FAQ and troubleshooting).